The headline numbers
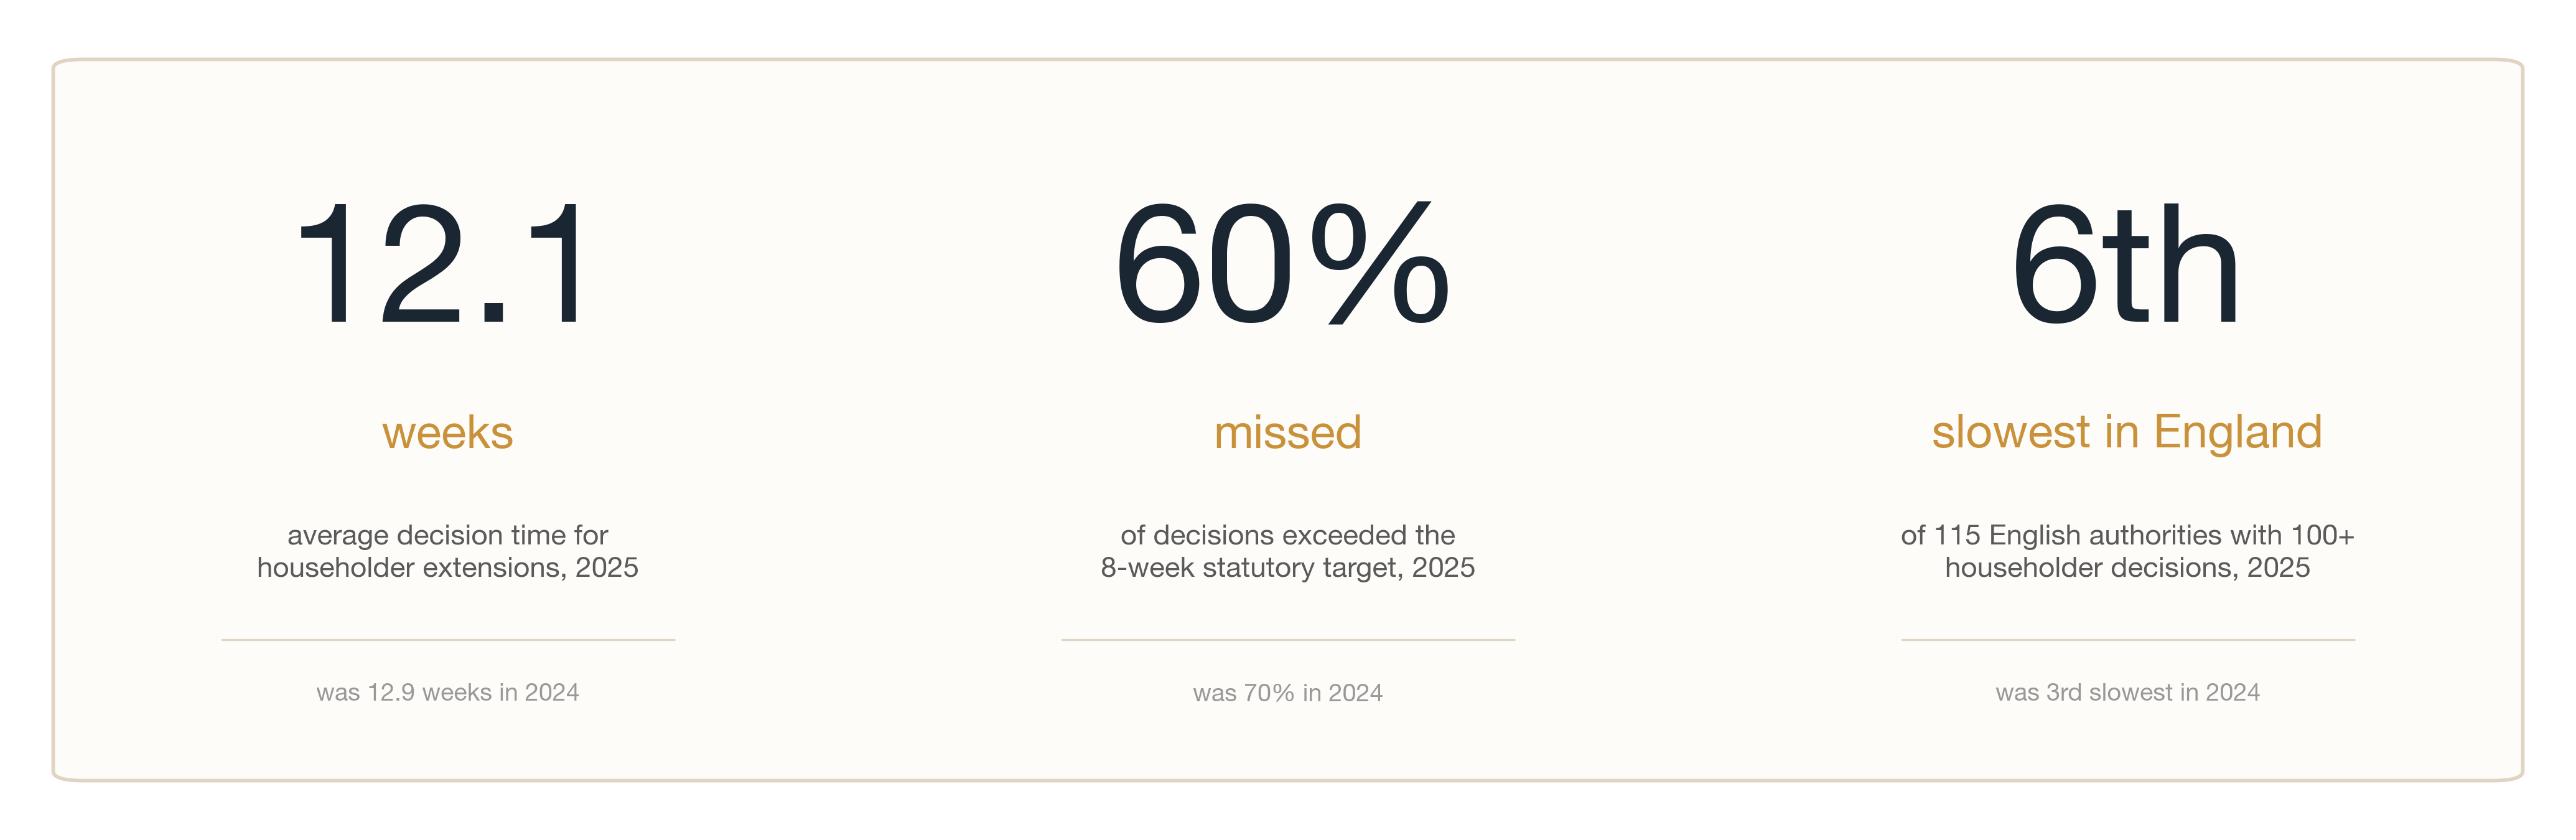
In 2025, 60% of householder extension applications in Canterbury missed the 8-week statutory deadline — nearly twice the England average, and the sixth-slowest mean decision time of any English planning authority. It is the second consecutive year at this level, after a sharp deterioration in 2024.
The 2024 figure is not a continuation of an existing trend. Between 2021 and 2023, Canterbury's mean time-to-decision sat between 10.5 and 11 weeks, with the share of applications missing the eight-week target running in the high forties to mid fifties. In 2024 both numbers stepped up sharply — mean weeks rose by more than a fifth and the miss rate jumped by more than twenty percentage points. The 2025 data shows a partial recovery, but the council has not returned to its pre-2024 baseline. Partial 2026 data (n=200) shows no further deterioration, but is too early to confirm sustained recovery: early-year samples systematically over-represent faster decisions, since slower applications are still in the system.
Nationally, the trend has been one of mild, broad deterioration: the share of householder extension decisions across England missing the 8-week target edged up from 24.0% in 2019 to 33.4% in 2025, with the mean rising by about a week over the same period. Canterbury's path is far steeper. Its 2024 jump was a local event rather than a reflection of that national drift, and the 2025 figures show little structural change: the mean has fallen by just under a week since 2024 and the miss rate by ten percentage points, but the gap to the England average is now 26.5 percentage points — wider than at any point before the 2024 spike.
Within the district, refusal rates vary by a factor of five across the 21 wards. The high-refusal cluster splits into two distinct geographies: a city-centre conservation axis anchored by Westgate, and a coastal-character axis running through Seasalter, Reculver and Beltinge. The leafy suburbs of Canterbury and Whitstable — St Stephens, West Bay, Northgate, Tankerton — cluster at the opposite end of the table.
Key findings
- 60% of Canterbury householder extensions missed the 8-week statutory target in 2025, against an England average of 33% — a partial recovery from the 2024 peak of 70%, but still well above pre-2024 levels, and the sixth-slowest mean decision time in England.
- The high-refusal cluster splits in two: a city-centre conservation axis (Westgate, 12.6%) and a coastal-character axis around Whitstable and Herne Bay (Seasalter 11.3%, Reculver 9.2%).
- St Stephens is the easiest ward in which to extend, with a 2.5% refusal rate — five times lower than Westgate.
- The 2024 spike was a Canterbury event, not a national one. The England average rose 1.3 weeks between 2019 and 2024; Canterbury's mean rose by more than that in 2024 alone.
When the delays got worse
Canterbury's slowdown was not a gradual decline. It was a single year — 2024 — in which the share of applications missing the 8-week target jumped from already-elevated to acute.
Figure 1Share of householder extensions missing the 8-week statutory target
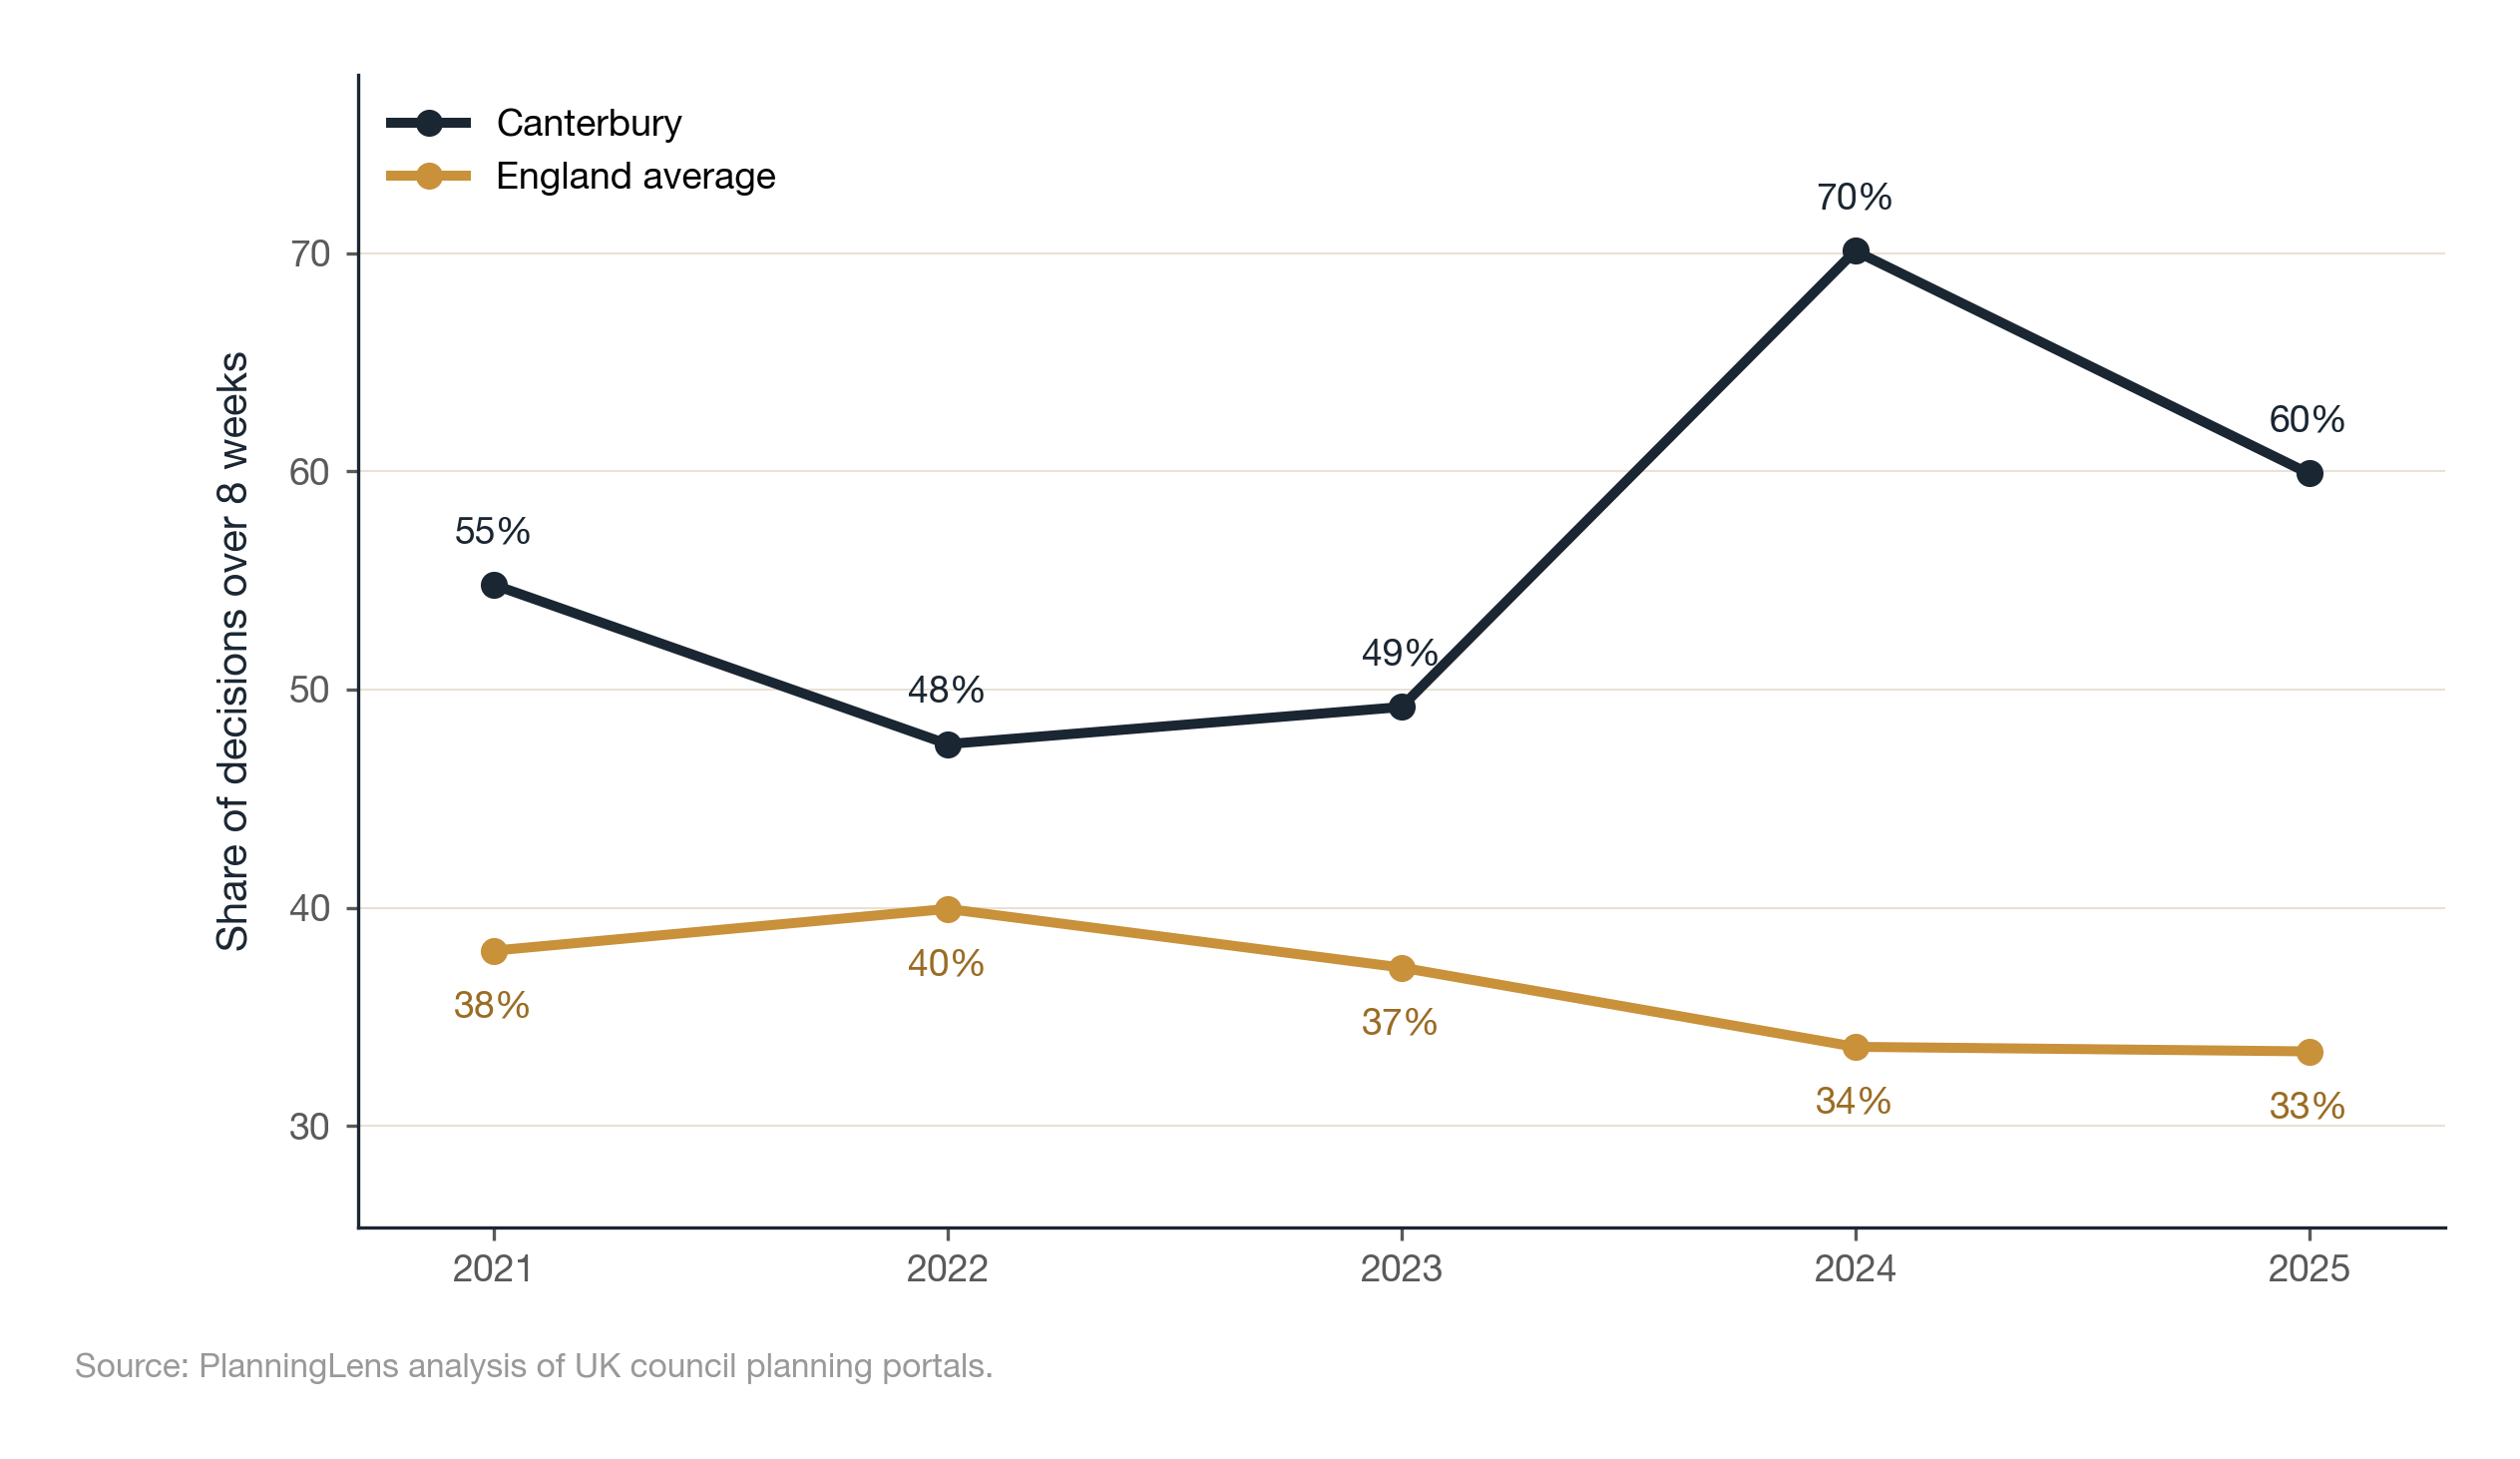
Through 2021, 2022 and 2023, the share of Canterbury householder applications taking longer than eight weeks ranged from 47% to 55% — consistently above the England average of around 37-40% across the same period, but stable. The 2024 figure of 70% is not an extension of that trend. It is a step change. More than two-thirds of homeowners who applied to extend their property that year waited longer than the statutory target for a decision, against just under one in three nationally.
The 2025 figure suggests a partial recovery to 60%, but the gap to the England line (33%) has widened, not closed. Canterbury was running an average of roughly 12 percentage points above the national figure across 2021–2023; it is now running 26.5 percentage points above it. Whatever drove the 2024 spike has not been fully resolved.
The data does not on its own explain what changed. Common candidates would include planning department resourcing, a temporary backlog from earlier in the cycle, or shifts in the mix of applications being submitted — none of which can be confirmed from the decisions data alone. The pattern is consistent across the year rather than concentrated in any single quarter, which argues against a one-off operational disruption.
Figure 2Average time from validation to decision, householder extensions
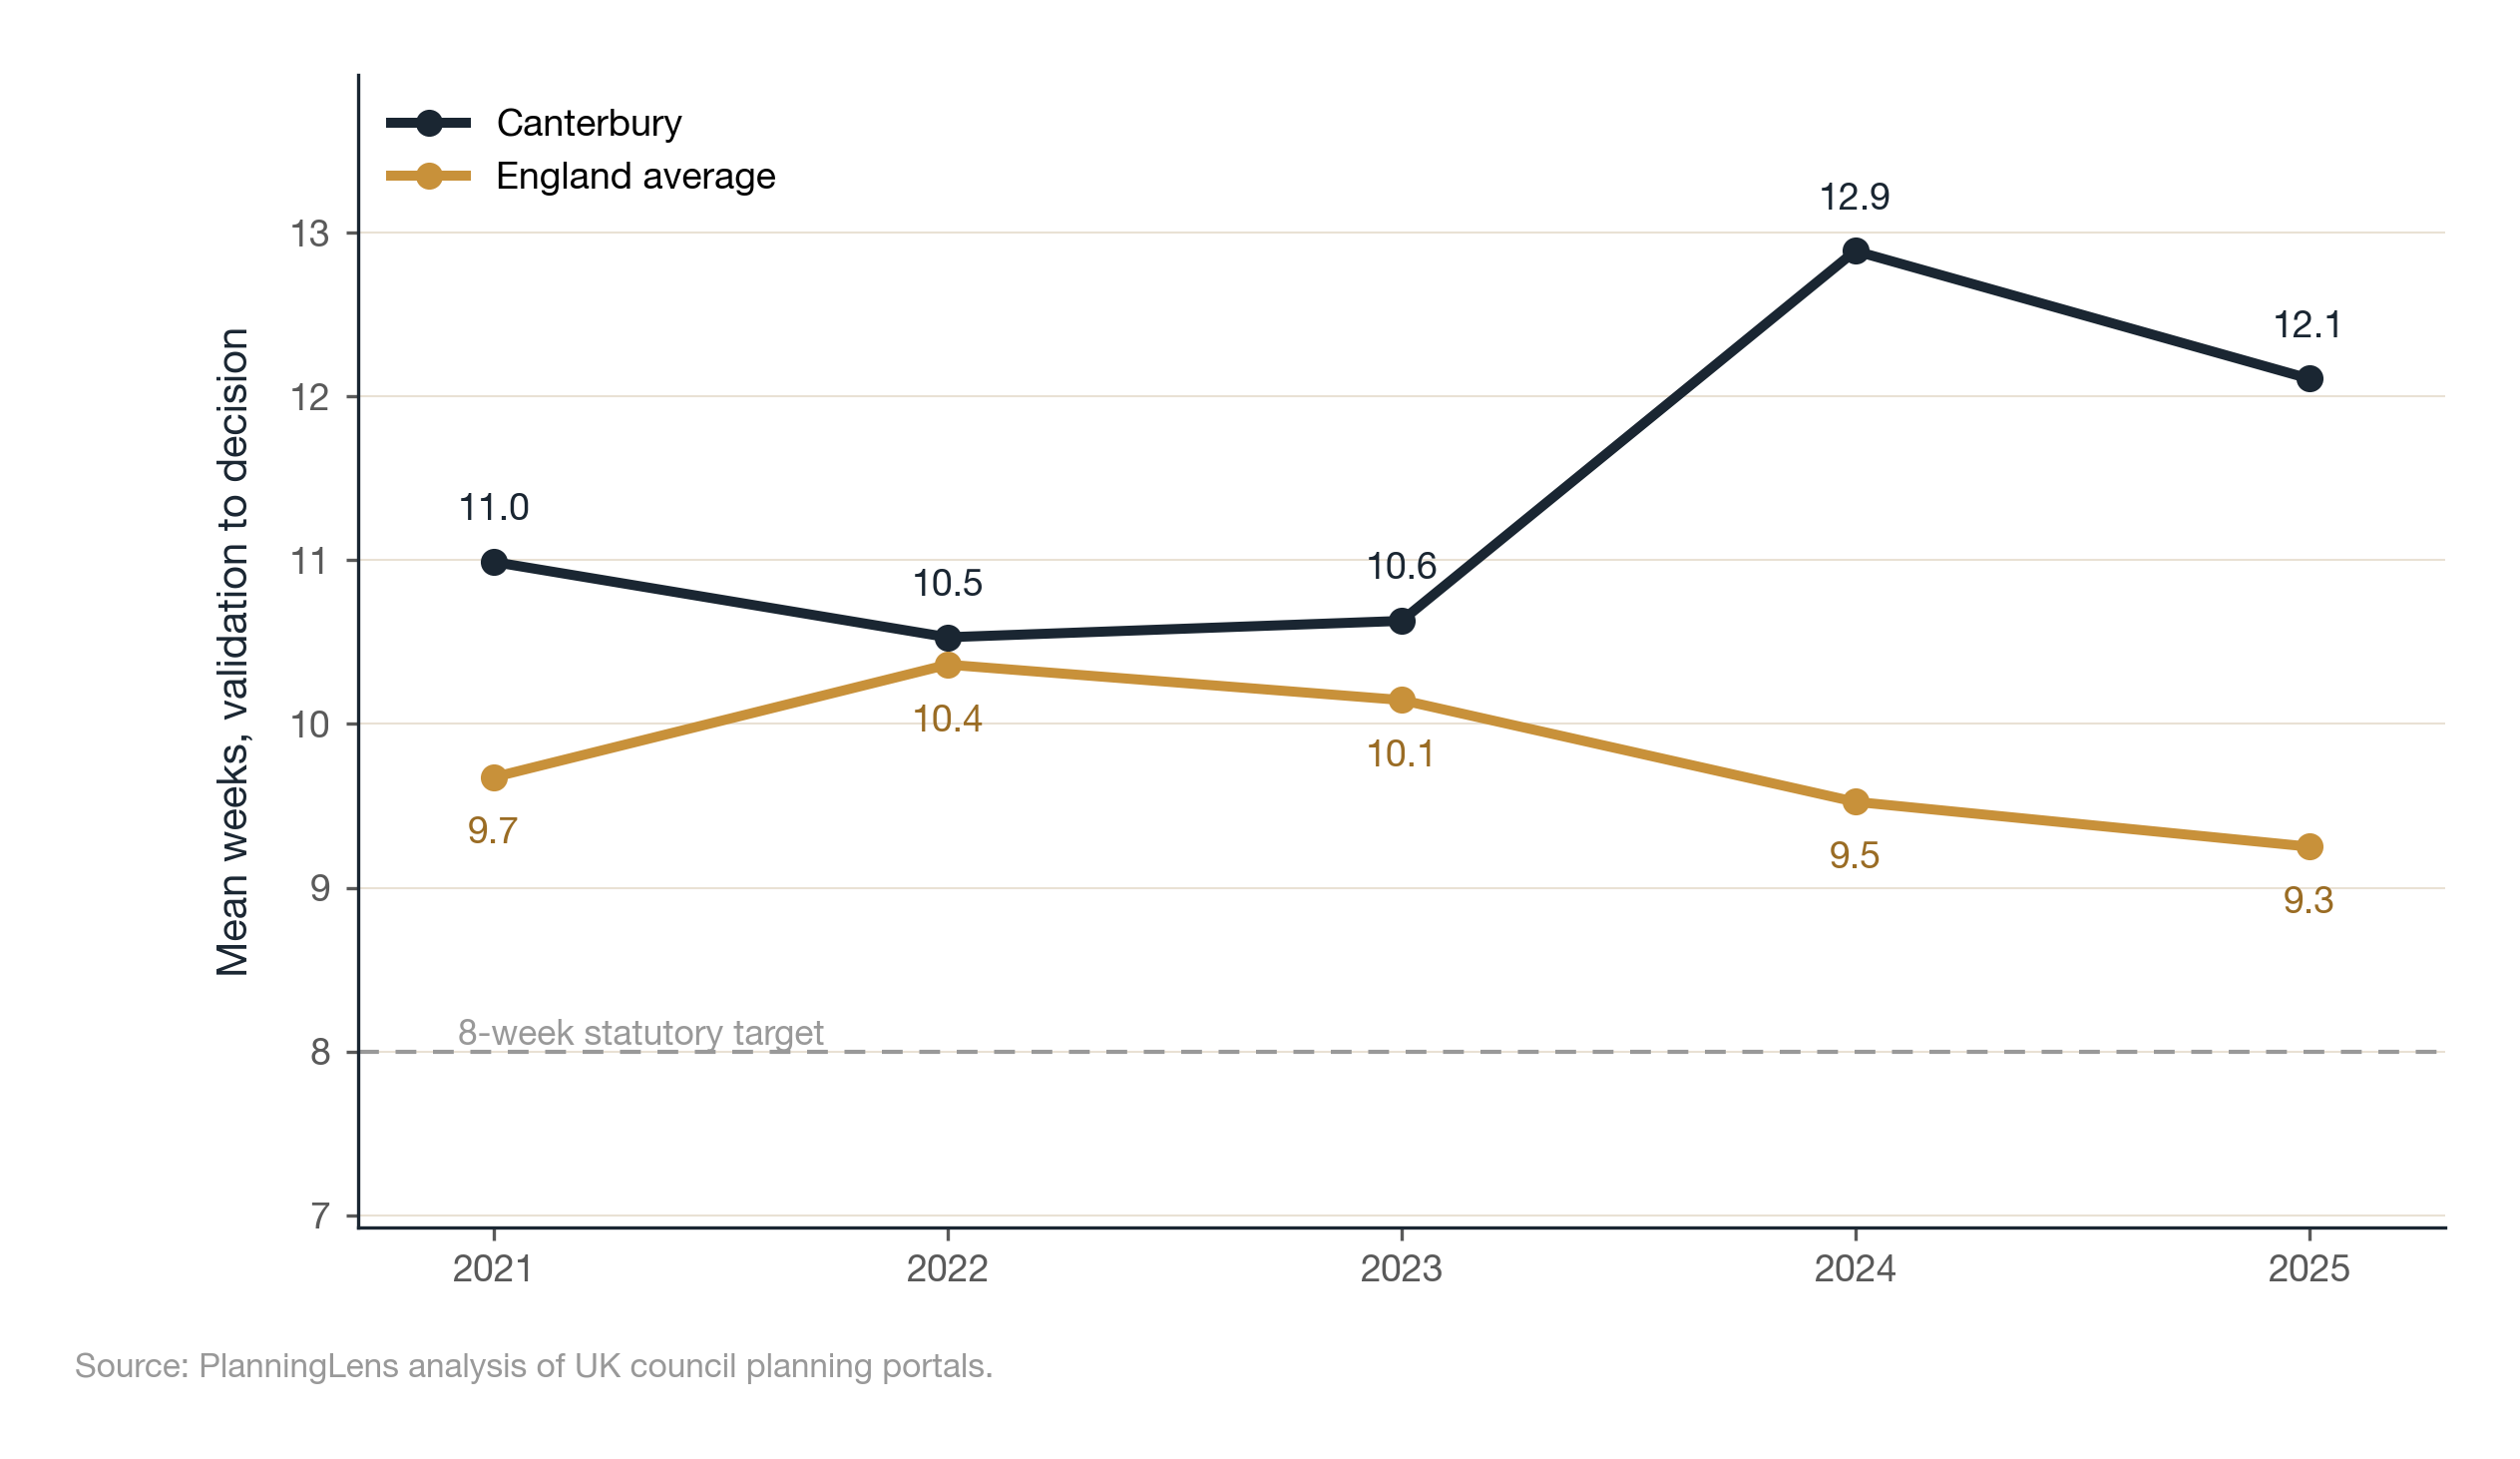
The mean time-to-decision view tells a related but slightly different story. The miss rate (Figure 1) captures the share of applications failing the statutory test; the mean (Figure 2) captures how badly. Canterbury's pre-2024 mean of 10.5 to 11 weeks was already two and a half to three weeks above the eight-week target, so a typical applicant in 2021–2023 was waiting roughly a third longer than the statute envisages. In 2024 the mean rose to 12.9 weeks — more than half as long again as the target — before settling to 12.1 weeks in 2025.
The two measures move in the same direction but capture different things. A council can hit most of its deadlines and still post a high mean if a handful of cases run very long (low miss rate, high mean); or it can be late on most decisions by only a week or two (high miss rate, mean only modestly above target). Canterbury in 2024 was failing on both: the 70% miss rate shows the lateness was broad, and a mean nearly five weeks beyond the statutory target shows it was substantial. Most applicants waited well past the eight-week mark, and a minority waited considerably longer.
Where in Canterbury matters
Behind the district-level numbers is a more interesting picture: refusal rates vary by a factor of five across Canterbury's 21 wards, and the high-refusal areas split into two distinct geographies.
Figure 3Householder refusal rates by Canterbury ward
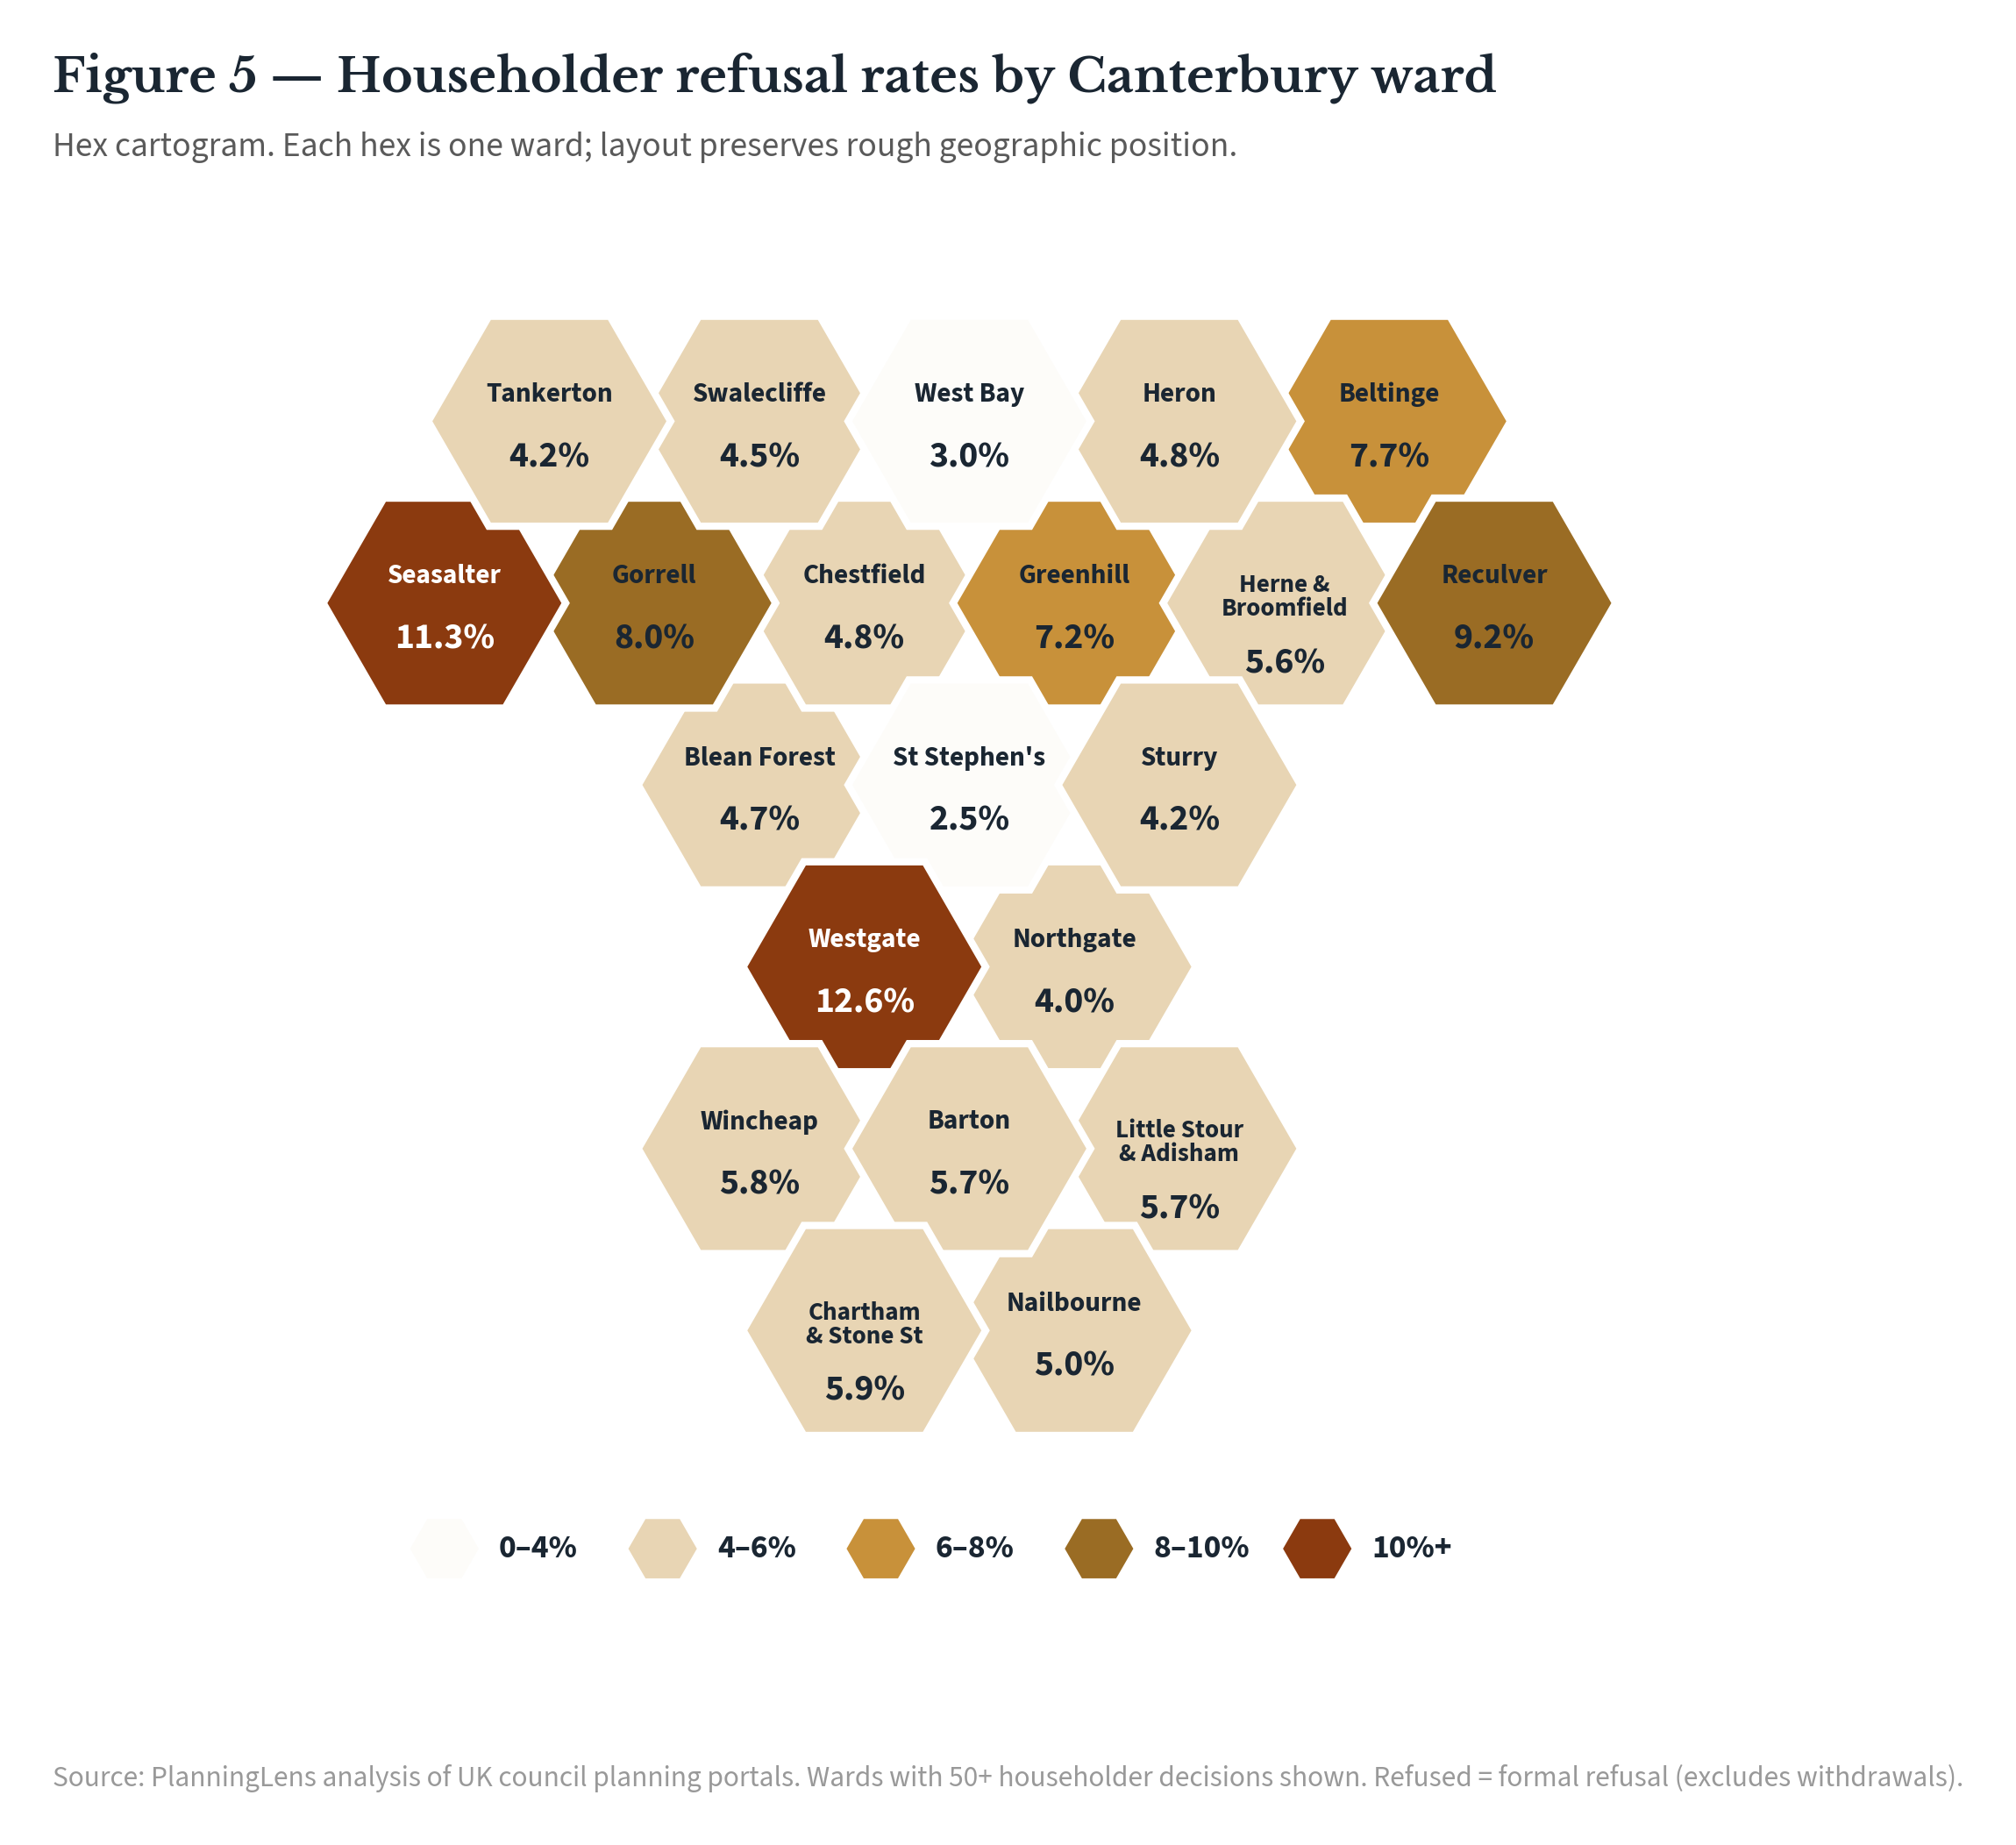
The highest refusal rate in the district is in Westgate, the ward covering the medieval core of the city — 12.6% of householder applications formally refused over the period, on a sample of 119 decisions. Westgate is dense with conservation-area properties, listed buildings, and the visual constraints that come with proximity to the Cathedral. A refusal rate roughly twice the district average is consistent with what one would expect from a planning environment where design and heritage controls bite hard.
More striking is the coastal cluster. Seasalter (11.3% refusal, n=265) and Reculver (9.2%, n=98) sit on the Whitstable and Herne Bay coastlines respectively, neither carries the heritage density of the city centre, and both produce refusal rates substantially above the district norm. Beltinge (7.6%, n=171) and Gorrell (7.9%, n=418) extend the coastal pattern. Seasalter in particular is worth noting: at n=265 it is the largest sample of any high-refusal ward in the district, which makes the signal statistically robust rather than an artefact of small numbers.
At the opposite end of the table sit the suburban wards. St Stephens (2.5% refusal, n=120), West Bay (3.0%, n=99) and Northgate (4.0%, n=50) anchor the bottom, followed closely by Tankerton, Sturry and Swalecliffe — all between 4.2% and 4.5%. These are the parts of Canterbury and Whitstable where extending a home is, on the evidence of the last five years, most likely to result in a permission.
Figure 4Householder refusal rates by Canterbury ward, ranked
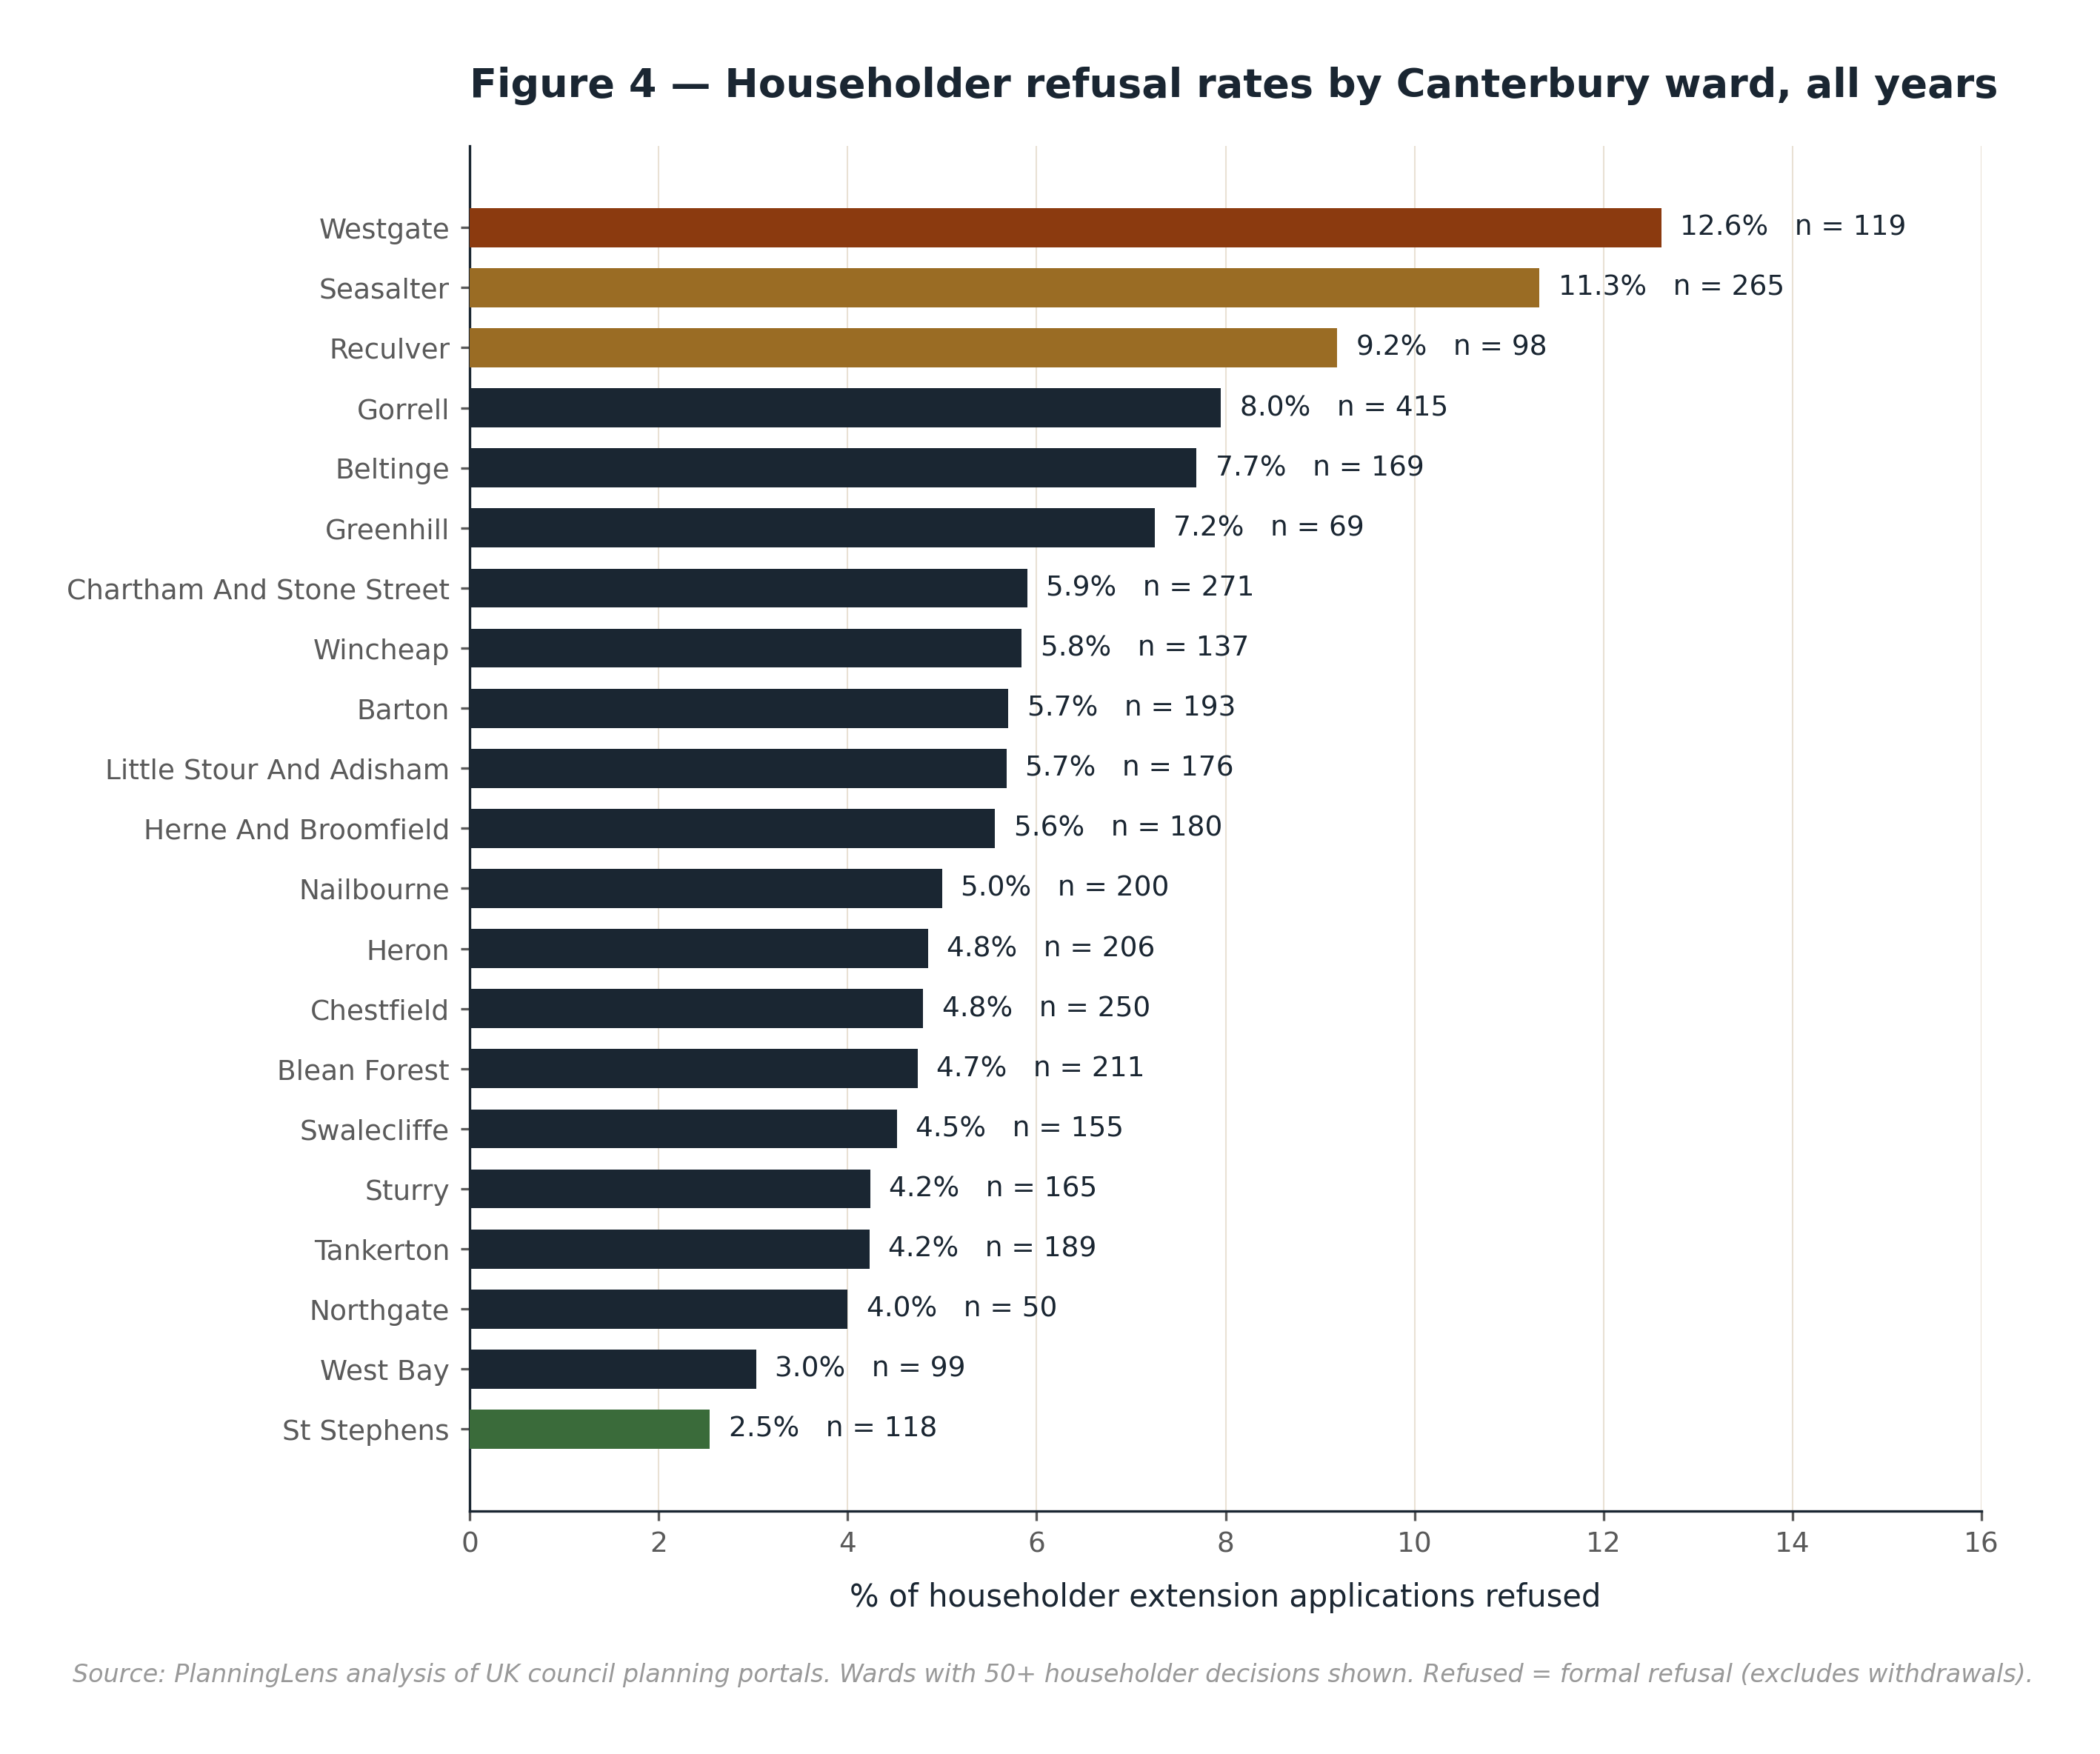
Figure 4 gives the precise numerical view by ward, with samples ranging from 50 decisions (Northgate) to 415 (Gorrell). The wards highlighted in rust and dark gold are the five with the highest refusal rates; the wards highlighted in green are the three with the lowest. The coastal pattern noted above is visible as a band of dark-gold wards through the upper half of the chart — Seasalter, Reculver, Beltinge, Gorrell — alongside Westgate's lone city-centre rust bar.
One observation worth flagging for future analysis is Seasalter. Whitstable has seen sustained pressure from holiday-let conversions and HMO applications over the last several years, and Seasalter's combination of high refusal rate and large sample size makes it the strongest candidate within the district for a deeper look at what is being refused, and why. That sits outside the scope of this briefing but is the natural follow-up question.
A local story, not a national one
It would be reasonable to assume that a slowdown this pronounced reflects a wider national pattern. It does not. Across England, the share of householder extension decisions missing the 8-week statutory target rose only gradually over recent years — from 24.0% in 2019 to 33.4% in 2025 — with the mean time to decision rising by about a week across the same period. The system has been getting slower, but slowly.
Canterbury's trajectory sits well outside that drift. Where the national miss rate moved by about nine percentage points across six years, Canterbury's rose by more than twenty in the single year of 2024, peaking at 70% before settling to 60% in 2025. As Figure 1 shows, the district was already running consistently above the England average before 2024; the gap has since widened to 26.5 percentage points, wider than at any point before the 2024 spike. Whatever drove the 2024 step change was specific to Canterbury, not a reflection of national conditions.
The standard explanations for an isolated local slowdown — a temporary backlog working through the system, a change in planning-department resourcing, or a shift in the mix of applications submitted — cannot be confirmed or ruled out from the decisions data alone. What the data does establish is that the deterioration was real, was concentrated in 2024, and has not fully reversed. That is the case that merits a closer look.
What to expect
The headline figures in this briefing are useful for understanding what is happening at a district level, but they are not the numbers a homeowner planning an extension actually needs. The questions a householder is likely to be asking are simpler: how long should I expect to wait, where in Canterbury am I applying, and what is the realistic likelihood of an approval. This section translates the data into those terms.
Timeline expectations
A homeowner submitting a householder application in Canterbury in 2025 waited an average of 12.1 weeks — approaching three months — between the validation of their application and the council's decision. That figure is a partial recovery from the 2024 peak of 12.9 weeks but remains well above the council's pre-2024 baseline of 10 to 11 weeks. It also does not include the time between submission and validation, which is typically a further two to three weeks while the council checks the application is complete, nor any pre-application advice period the homeowner may have engaged in beforehand. End-to-end, planning a Canterbury extension that needs full householder consent should be assumed to take three to four months from initial submission to a decision being issued.
For homeowners with builders booked, finance arranged or summer build windows in mind, this matters. A loft conversion expected to start in May based on a February submission will, on the 2025 average, more likely start in late June or July. Planning that schedule on the eight-week statutory target is, on the recent evidence, a risk.
Ward-by-ward expected approval rates
The table below shows the householder approval rate for every Canterbury ward with 50 or more decisions in the period, ranked from highest to lowest. Approval rate here means the share of decided householder applications — those granted or refused — that were granted; withdrawn and non-determination cases are excluded from the denominator.
| Ward | Approval rate | Decisions |
|---|---|---|
| St Stephens | 97.5% | 120 |
| West Bay | 97.0% | 99 |
| Northgate | 96.0% | 50 |
| Tankerton | 95.8% | 189 |
| Sturry | 95.8% | 168 |
| Swalecliffe | 95.5% | 157 |
| Blean Forest | 95.3% | 211 |
| Chestfield | 95.2% | 252 |
| Heron | 95.2% | 207 |
| Nailbourne | 95.0% | 201 |
| Herne & Broomfield | 94.4% | 180 |
| Little Stour & Adisham | 94.3% | 176 |
| Barton | 94.4% | 195 |
| Wincheap | 94.2% | 138 |
| Chartham & Stone Street | 94.1% | 272 |
| Greenhill | 92.8% | 69 |
| Beltinge | 92.4% | 171 |
| Gorrell | 92.1% | 418 |
| Reculver | 90.8% | 98 |
| Seasalter | 88.7% | 265 |
| Westgate | 87.4% | 119 |
When the delays bite
The validation-to-decision window is the part of the process that has slipped most visibly in Canterbury. It is also the part homeowners have least control over: once an application has been validated, the council's caseload, officer availability and any consultee response times determine the wait. Builders booked for a particular month, finance arrangements with completion deadlines, or projects timed around a summer build window are all vulnerable to a planning slip in this slice.
The slice homeowners can influence is the one before validation: the quality of the submission itself. Applications that are incomplete, that lack a clear design and access statement, or that miss the council's particular expectations for the property type, will sit in a queue waiting for validation before the eight-week clock formally starts. For properties in conservation areas, near listed buildings, or in the coastal wards where refusal rates are highest, the case for paying for pre-application advice or engaging a planning consultant is correspondingly stronger.
How this was put together
Sample
This briefing is based on every Canterbury City Council planning decision between January 2021 and December 2025 in which the application validation date is known and the decision is one of granted, approved, refused, or rejected. Withdrawn, closed, and non-determination outcomes are excluded. Time-to-decision values outside the range 0–730 days are treated as data-entry errors and excluded.
Householder extensions
The "householder extension" category covers four sub-types: loft conversions (loft, dormer, mansard, roof extension), single-storey extensions (including ground-floor extensions), two-storey extensions (including first-floor and double-storey extensions), and rear extensions. Applications are matched on proposal text using keyword classifiers; commercial, change-of-use, and listed-building consent applications are excluded.
National comparisons
National figures are computed across PlanningLens' coverage of more than 240 UK planning authorities, using the same householder filter and the same decision classifier. The England average shown in Figure 1 is a weighted mean across English authorities only. Canterbury's national ranking is computed among the 115 English authorities with at least 100 decided householder applications in 2025. Decision time is measured from validation to decision where a validation date is published; for the minority of authorities whose portals expose only a received date, that date is used instead. National aggregates are dominated by validation-based authorities, and Canterbury itself is measured from validation throughout.
Extensions of time
Official figures published by the Ministry of Housing, Communities and Local Government (MHCLG) measure the speed of planning decisions differently from this briefing. The official statistics record a decision as made "in time" if it is issued within the statutory period or within an extension of time agreed in writing with the applicant; on that basis, 93% of householder decisions in England were made in time in the year ending March 2026. The figures in this briefing are not measured that way. PlanningLens measures the elapsed time between the validation of an application and the decision issued on it, and does not count an agreed extension as an on-time decision. The two approaches answer different questions: the official measure captures whether a council met a deadline it may have re-set by agreement, while the measure used here captures how long an applicant waited once their application was valid. Agreed extensions are now a routine feature of the system — a performance agreement was attached to around 41% of all English planning decisions in 2025, a share that has risen steadily since 2013 — so the gap between the two measures is both wide and widening. Canterbury's in-time figure on the official basis will therefore be markedly higher than the figures shown here; that difference reflects the change in method, not a contradiction in the underlying data, since a decision the council records as "in time" under an agreed extension still appears here as the number of weeks it actually took.
Ward boundaries
Ward names match the canonical names used in Canterbury City Council's published planning records. The hex cartogram layout follows the Open Innovations 2024 hex layout for English wards.
Reproducibility
All national and trend figures in this briefing are computed by a single canonical script (ttd_tightened_v3.py, with council coverage defined by council_registry.py); ward-level statistics are produced by a Canterbury-specific export (export_canterbury_v2.py) using the same decision and householder classifiers. All three are available on request — email hello@planninglens.co.uk. Any subsequent corrections to the methodology will be applied retrospectively to all PlanningLens Research outputs.
About PlanningLens
PlanningLens is an independent planning-data project covering more than 240 UK local planning authorities. It scrapes public planning portals and structures the resulting decisions into a queryable database. PlanningLens Research is the analysis arm that publishes briefings drawn from that data.
Author: Mark Broome · hello@planninglens.co.uk · planninglens.co.uk