Housing test hits councils approving major schemes at the same rate as councils it spares
Outside heavily Green Belt areas, councils below 75% on the Housing Delivery Test approved 81% of major housing decisions. Councils at 95% or above also approved 81%. In heavily Green Belt areas the picture was markedly different.
Major housing decisions approved outside heavily Green Belt areas, April 2022 to March 2025: councils below 75% on the 2025 Housing Delivery Test (1,428 of 1,762) against councils at 95% or above (3,598 of 4,444).
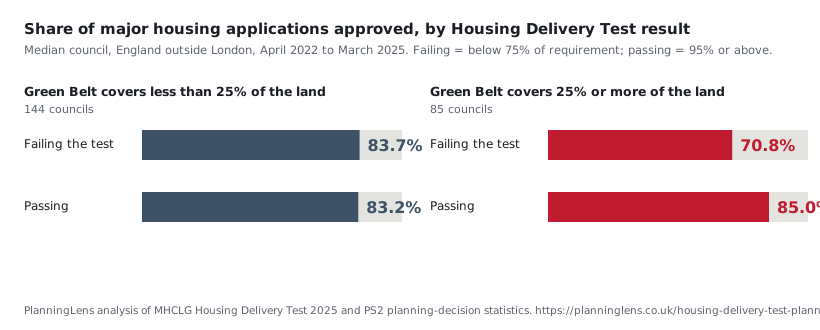
What the figures show
Councils across much of England face the government's toughest housing-test consequence even though they approved major applications at the same rate as councils facing no consequence.
PlanningLens matched the 2025 Housing Delivery Test with 12,595 official MHCLG decisions on major housing applications across 229 councils. Outside heavily Green Belt areas, councils below 75% approved 81.0% of decisions. Councils at 95% or above also approved 81.0%.
The pattern changes sharply in heavily Green Belt areas. There, failing councils approved a median 70.8% of major applications, compared with 85.0% among councils at 95% or above.
A score below 75% now counts as evidence of unmet housing need under the new National Planning Policy Framework, strengthening the case for development outside settlements. Green Belt land is governed separately.
| Green Belt coverage | Failed test (below 75%) | Passed (95% or more) | Difference |
|---|---|---|---|
| Less than 25% of the land 144 councils | 83.7% | 83.2% | +0.5 points |
| 25% or more 85 councils | 70.8% | 85.0% | -14.2 points |
Heavily Green Belt areas
Most of the councils that both missed their target and refused often are the districts around London. Mole Valley approved 39% of its 36 major applications and delivered 72% of the homes required. Epping Forest approved 47% and delivered 66%. St Albans approved 62% and delivered 46%. Sevenoaks, Hertsmere and Tandridge each approved about two-thirds of their major schemes while delivering between 25% and 38% of their target.
Green Belt is an obvious potential constraint in these authorities, but MHCLG's statistics do not record why individual applications were refused. The analysis therefore cannot say whether Green Belt caused either the lower approval rate or the lower delivery. What it shows is that the two go together in Green Belt-heavy councils and not elsewhere.
Not every Green Belt council fits the pattern. Bradford, Kirklees, Stockport and Basildon are all heavily Green Belt, all failed the test and all approved between 86% and 90% of their major schemes. Taken together, the 85 Green Belt-heavy authorities approved 80.1% of major applications, in line with the rest of England (80.5%).
Elsewhere in England
The 35 councils that failed the test outside heavily Green Belt areas are largely England's cities and their neighbours. Bristol delivered 41% of the homes required while approving 92 of 102 major applications. Birmingham delivered 57% and approved 124 of 145. Sheffield delivered 58% and approved 93 of 110. Sandwell and Wolverhampton approved 89% and 96% of their major schemes and delivered 34% and 59% of their targets. A few failing councils outside the Green Belt did refuse often (Horsham approved 49% of its major schemes, Lancaster 54%, Lewes 57%), but as a group they are indistinguishable from the councils that passed.
What this looks like in individual councils
| Council | Housing target achieved | Major schemes approved | Green Belt |
|---|---|---|---|
| Bristol | 41% | 90%92 of 102 | 6% |
| Birmingham | 57% | 86%124 of 145 | 14% |
| Sheffield | 58% | 85%93 of 110 | 24.6% |
| Mole Valley | 72% | 39%14 of 36 | 76% |
| Epping Forest | 66% | 47%18 of 38 | 91% |
| St Albans | 46% | 62%37 of 60 | 82% |
| Sevenoaks | 25% | 67%32 of 48 | 93% |
| Wirral | 123% | 63%36 of 57 | 46% |
Bristol, Birmingham and Sheffield all missed their targets by a wide margin while approving more than four in five of the major schemes put to them. Mole Valley, Epping Forest, St Albans and Sevenoaks missed theirs while approving between two-fifths and two-thirds, in districts where Green Belt covers three-quarters or more of the land. Wirral shows the two things can come apart even in the Green Belt: it delivered 123% of its target while approving 63% of its major applications.
Why it matters
The test's consequences make planning policy more permissive where homes are not being built. Below 95% a council must publish an action plan. Below 85% it must show a larger buffer of housing land. A score below 75% now counts as evidence of unmet housing need under the new National Planning Policy Framework, strengthening the case for development outside settlements. Green Belt land is governed separately.
In heavily Green Belt England, the councils now labelled as having unmet need are broadly the ones approving fewer major schemes, although that route does not apply to Green Belt land. Across the rest of England the same label falls on councils whose approval rates are no different from those it spares.
The decisions analysed run to March 2025, almost entirely before grey belt changed Green Belt decision-making, so this is a baseline for the old regime. We will re-run the same analysis, unchanged, when the 2026 test is published, and again when MHCLG's figures first cover a full year under grey belt.
What the figures don't prove
The analysis shows an association, not cause and effect. It cannot show that planning refusals caused under-delivery, that Green Belt caused either outcome, or that homes given permission subsequently went unbuilt. MHCLG counts planning decisions rather than the number of homes in each application, and its major-dwellings figures include reserved-matters and section 73 decisions. Approval and delivery are also measured over the same three-year period, although homes completed during it may have received permission earlier.
Methodology
The test results come from MHCLG's Housing Delivery Test: 2025 measurement. Planning decisions come from MHCLG's Live tables on planning application statistics (PS2 open data table), for the twelve quarters from April 2022 to March 2025, the period the 2025 test measures. A major housing application, in MHCLG's definition, is a scheme of ten or more homes, or a site of half a hectare or more where the number is not known. Green Belt coverage comes from MHCLG's Local authority Green Belt statistics for England: 2024 to 2025.
A council is included if it made at least 20 major housing decisions over the three years and returned data for at least ten of the twelve quarters; 229 councils outside London qualify. London is analysed separately because its housing is often recorded under mixed-use schemes. Failing means below 75% of the housing requirement; passing means 95% or above. The approval rates quoted are those of the median council in each group. The methodology was registered before the results were analysed. The underlying CSV, the pre-registration, the full results and the analysis code are published below.
Sources and downloads
Data: Housing Delivery Test 2025 and major housing approval by council (CSV, 301 rows), licence CC BY 4.0 with attribution to PlanningLens; the underlying figures are MHCLG statistics under the Open Government Licence. Pre-registration (frozen 2 September 2026, four logged amendments) · full results (re-frozen 3 September after the identifier correction) · results as first frozen on 2 September · analysis code · four-number chart · scatter chart of all 229 councils.

Official sources: Housing Delivery Test: 2025 measurement · Live tables on planning application statistics (PS2 open data table) · Local authority Green Belt statistics for England: 2024 to 2025 · National Planning Policy Framework (August 2026).
Related PlanningLens research: committee versus delegated planning decisions · how long planning permission takes · planning approval rankings by council.
For quotation. Attribution: "PlanningLens analysis of MHCLG Housing Delivery Test and planning-decision statistics", with a link to this page. Corrections and questions: hello@planninglens.co.uk.
Frequently asked questions
What is the Housing Delivery Test?
An annual MHCLG measurement comparing the net homes completed in a planning authority's area over the previous three financial years with the homes it was required to deliver, expressed as a percentage. The 2025 measurement covers 2022/23 to 2024/25 and was published on 17 August 2026.
What happens when a council fails the Housing Delivery Test?
Under the National Planning Policy Framework published in August 2026, a result below 95% requires an action plan, below 85% requires a larger buffer of deliverable housing land, and below 75% is treated as evidence of unmet housing need for the purposes of policy S5(1)(j), which supports development outside settlements. S5 does not apply to Green Belt land, which has its own policies.
Do councils that fail housing targets reject more housing applications?
Outside heavily Green Belt areas, no: councils below 75% on the 2025 test approved 81.0% of major housing decisions and councils at 95% or above approved 81.0%; counting each council equally, medians of 83.7% and 83.2%. Where Green Belt covers a quarter or more of the land, yes on average: median approval 70.8% against 85.0%.
Does Green Belt explain housing under-delivery?
The analysis cannot say. Lower approval rates and lower delivery go together in Green Belt-heavy authorities and not elsewhere, but MHCLG's decision statistics record no reasons for refusal, so the analysis makes no causal claim in either direction.
What counts as a major housing application?
In MHCLG's statistics, development of ten or more dwellings, or a site of half a hectare or more where the number of dwellings is not known, classified by the principal use of the scheme.
What proportion of major housing applications are approved?
80.3% of the 13,401 decisions on major housing applications in the 250 eligible English authorities, April 2022 to March 2025 (10,759 granted, 2,642 refused). This includes reserved-matters and section 73 decisions, which are nearly always granted, so it overstates the approval rate for brand-new schemes.
The evidence in full
Everything below is the working behind the figures above: all 229 councils, the full lists of failing councils, the pre-registered anomaly lists, the statistical checks and the complete methodology.
Explore all 229 councils (scatter chart)
Each point is one council. Red: Green Belt covers 25% or more of the land; blue: less. The dashed bars are the group medians. Twelve councils above 250% on the test are drawn at the right-hand edge. Hover over a point for the council.
The 27 Green Belt-heavy councils that failed the test
| Council | Housing target achieved | Major schemes approved | Green Belt |
|---|---|---|---|
| Mole Valley | 72% | 39%14 of 36 | 76% |
| Epping Forest | 66% | 47%18 of 38 | 91% |
| St Albans | 46% | 62%37 of 60 | 82% |
| Elmbridge | 59% | 62%46 of 74 | 58% |
| Spelthorne | 33% | 63%17 of 27 | 65% |
| Windsor and Maidenhead | 74% | 64%41 of 64 | 82% |
| Dacorum | 52% | 65%17 of 26 | 50% |
| Hertsmere | 26% | 67%22 of 33 | 79% |
| Sevenoaks | 25% | 67%32 of 48 | 93% |
| Slough | 54% | 68%25 of 37 | 27% |
| Tandridge | 38% | 68%21 of 31 | 94% |
| Welwyn Hatfield | 46% | 69%27 of 39 | 77% |
| Walsall | 56% | 70%39 of 56 | 38% |
| Bromsgrove | 58% | 71%17 of 24 | 89% |
| Bournemouth, Christchurch and Poole | 35% | 71%122 of 172 | 35% |
| Thurrock | 29% | 75%15 of 20 | 71% |
| Gravesham | 61% | 77%17 of 22 | 77% |
| Erewash | 49% | 82%18 of 22 | 72% |
| Chorley | 63% | 83%24 of 29 | 72% |
| North Somerset | 64% | 83%45 of 54 | 42% |
| Tonbridge and Malling | 63% | 84%41 of 49 | 71% |
| South Tyneside | 53% | 86%18 of 21 | 36% |
| Solihull | 53% | 86%25 of 29 | 67% |
| Stockport | 43% | 86%32 of 37 | 46% |
| Basildon | 23% | 87%27 of 31 | 63% |
| Bradford | 56% | 89%79 of 89 | 65% |
| Kirklees | 65% | 90%112 of 124 | 61% |
The 35 other councils that failed the test
| Council | Housing target achieved | Major schemes approved | Green Belt |
|---|---|---|---|
| Wolverhampton | 59% | 96%46 of 48 | 12% |
| Gloucester | 63% | 95%21 of 22 | none |
| Fareham | 60% | 94%34 of 36 | none |
| Derby | 71% | 93%51 of 55 | 3% |
| Hastings | 44% | 91%21 of 23 | none |
| North Tyneside | 65% | 91%29 of 32 | 20% |
| Bristol | 41% | 90%92 of 102 | 6% |
| Sandwell | 34% | 89%47 of 53 | 10% |
| North Norfolk | 54% | 88%30 of 34 | none |
| Southend-on-Sea | 20% | 87%26 of 30 | 14% |
| Ipswich | 63% | 87%26 of 30 | none |
| Medway | 60% | 87%65 of 75 | 7% |
| Charnwood | 62% | 87%45 of 52 | none |
| Birmingham | 57% | 86%124 of 145 | 14% |
| Torbay | 40% | 85%34 of 40 | none |
| Sheffield | 58% | 85%93 of 110 | 24.6% |
| Rother | 35% | 84%36 of 43 | none |
| Luton | 54% | 84%41 of 49 | 3% |
| Thanet | 70% | 82%55 of 67 | none |
| Coventry | 47% | 79%80 of 101 | 15% |
| New Forest | 48% | 78%29 of 37 | 7% |
| Southampton | 30% | 78%18 of 23 | none |
| Eastbourne | 23% | 78%18 of 23 | none |
| Leicester | 39% | 76%52 of 68 | none |
| Stoke-on-Trent | 66% | 76%32 of 42 | 19% |
| Swale | 70% | 76%66 of 87 | none |
| Cotswold | 68% | 76%25 of 33 | 0% |
| Cheltenham | 56% | 75%15 of 20 | 12% |
| Folkestone and Hythe | 57% | 75%24 of 32 | none |
| Isle of Wight | 37% | 74%35 of 47 | none |
| Brighton and Hove | 50% | 74%26 of 35 | none |
| Test Valley | 64% | 63%17 of 27 | none |
| Lewes | 60% | 57%24 of 42 | none |
| Lancaster | 48% | 54%29 of 54 | 3% |
| Horsham | 44% | 49%22 of 45 | none |
Pre-registered anomaly lists (Rules A and B)
The pre-registration committed us to publish two rule-based lists in full. Rule A: below 75% on the test with an approval rate in the top quarter of eligible councils (87.9% or above). Rule B: 100% or more on the test with an approval rate in the bottom quarter (73.7% or below).
| Council | Housing target achieved | Major schemes approved | Green Belt |
|---|---|---|---|
| Wolverhampton | 59% | 96%46 of 48 | 12% |
| Gloucester | 63% | 95%21 of 22 | none |
| Fareham | 60% | 94%34 of 36 | none |
| Derby | 71% | 93%51 of 55 | 3% |
| Hastings | 44% | 91%21 of 23 | none |
| North Tyneside | 65% | 91%29 of 32 | 20% |
| Kirklees | 65% | 90%112 of 124 | 61% |
| Bristol | 41% | 90%92 of 102 | 6% |
| Bradford | 56% | 89%79 of 89 | 65% |
| Sandwell | 34% | 89%47 of 53 | 10% |
| North Norfolk | 54% | 88%30 of 34 | none |
| Council | Housing target achieved | Major schemes approved | Green Belt |
|---|---|---|---|
| Maldon | 143% | 51%29 of 57 | none |
| Hart | 137% | 52%11 of 21 | none |
| Malvern Hills | 101% | 60%30 of 50 | none |
| West Berkshire | 114% | 61%43 of 71 | none |
| Babergh | 147% | 62%25 of 40 | none |
| Wirral | 123% | 63%36 of 57 | 46% |
| West Oxfordshire | 104% | 64%35 of 55 | 2% |
| Wychavon | 103% | 64%39 of 61 | 13% |
| Lichfield | 232% | 64%25 of 39 | 46% |
| Reading | 136% | 65%24 of 37 | none |
| Chichester | 124% | 66%29 of 44 | none |
| Braintree | 150% | 67%46 of 69 | none |
| Stratford-on-Avon | 202% | 68%34 of 50 | 23% |
| North Warwickshire | 164% | 68%15 of 22 | 61% |
| Waverley | 117% | 69%76 of 110 | 60% |
| Wokingham | 100% | 69%43 of 62 | 16% |
| Tendring | 152% | 69%43 of 62 | none |
| Forest of Dean | 128% | 69%25 of 36 | none |
| Cherwell | 134% | 70%59 of 84 | 14% |
| Reigate and Banstead | 102% | 70%26 of 37 | 68% |
| North Lincolnshire | 137% | 71%41 of 58 | none |
| Newark and Sherwood | 139% | 71%35 of 49 | 10% |
| Rugby | 187% | 71%25 of 35 | 58% |
| Uttlesford | 108% | 73%70 of 96 | 6% |
| Chelmsford | 110% | 74%25 of 34 | 38% |
Full robustness figures
The result held when we moved the definition of "heavily Green Belt" anywhere from 15% to 50% of council land, and when we doubled the minimum number of planning decisions required for inclusion. Further statistical checks pointed in the same direction. These checks were run after the pre-registered Green Belt cut and are labelled exploratory.
Correlations. Across all 229 councils the Spearman correlation between test result and approval rate is +0.25 (95% interval +0.11 to +0.37), a weak positive association under the pre-registered rule. In the 85 Green Belt-heavy councils it is +0.44 (+0.23 to +0.61); the gap between the failing and passing bands is -14.2 points (-18.8 to -2.0). In the other 144 it is +0.13 (-0.02 to +0.30); gap +0.5 points (-6.7 to +4.4).
Threshold sweep. Moving the Green Belt line from 15% to 50% of land area leaves the heavy-group correlation between +0.38 and +0.45.
| Threshold | Heavy n | Heavy correlation (95% interval) | Other n | Other correlation (95% interval) | Difference |
|---|---|---|---|---|---|
| 10% or more | 109 | +0.30 (+0.10 to +0.47) | 120 | +0.20 (+0.02 to +0.37) | +0.10 |
| 15% or more | 98 | +0.38 (+0.19 to +0.56) | 131 | +0.15 (-0.03 to +0.31) | +0.24 |
| 20% or more | 93 | +0.38 (+0.18 to +0.55) | 136 | +0.15 (-0.01 to +0.32) | +0.23 |
| 25% or more | 85 | +0.44 (+0.25 to +0.61) | 144 | +0.13 (-0.03 to +0.28) | +0.31 |
| 30% or more | 82 | +0.42 (+0.22 to +0.60) | 147 | +0.16 (-0.00 to +0.31) | +0.27 |
| 40% or more | 65 | +0.39 (+0.16 to +0.60) | 164 | +0.19 (+0.04 to +0.34) | +0.20 |
| 50% or more | 49 | +0.45 (+0.19 to +0.66) | 180 | +0.19 (+0.05 to +0.34) | +0.27 |
Permutation test. Shuffling the Green Belt labels 5,000 times, the observed difference in correlation between the groups (+0.31) is exceeded in 1.6% of shuffles (p = 0.016). At a floor of 40 decisions: +0.36, p = 0.046.
Higher sample floor. At 40 decisions per council: +0.47 (+0.16 to +0.69) in 45 Green Belt-heavy councils, medians 70.3% failing and 84.8% passing; +0.10 (-0.10 to +0.30) in the other 93, medians 83.7% and 81.9%.
Continuous moderator. Rank regression of approval on test result, Green Belt share and their interaction: interaction coefficient +0.34, t = 1.44, bootstrap interval -0.13 to +0.79. Same direction, not conclusive alone.
Pre-registered sensitivities. Excluding councils above 200% on the test, the overall correlation falls from +0.25 to +0.17 (+0.03 to +0.30), consistent with the Green Belt pattern. For minor housing applications (under ten homes) the pattern is weaker but present: +0.26 (+0.14 to +0.37), medians 69.4% failing and 73.6% passing. London, analysed separately as pre-registered: 21 boroughs, correlation -0.30 (-0.72 to +0.21), not comparable for inference.
| Housing Delivery Test result | Councils | Median approval | 95% interval | Interquartile range | Decisions-weighted approval | Major decisions |
|---|---|---|---|---|---|---|
| Below 75% (failed) | 35 | 83.7% | 76.5 to 86.7 | 75.8 to 87.5 | 81.0% | 1,762 |
| 75% to under 85% | 9 | 76.9% | 69.6 to 92.1 | 69.7 to 91.7 | 79.0% | 490 |
| 85% to under 95% | 21 | 74.7% | 71.7 to 84.2 | 69.0 to 88.1 | 78.7% | 1,465 |
| 95% and above (passed) | 79 | 83.2% | 79.7 to 85.1 | 75.5 to 90.6 | 81.0% | 4,444 |
| Housing Delivery Test result | Councils | Median approval | 95% interval | Interquartile range | Decisions-weighted approval | Major decisions |
|---|---|---|---|---|---|---|
| Below 75% (failed) | 27 | 70.8% | 66.7 to 82.8 | 66.0 to 83.5 | 73.4% | 1,292 |
| 75% to under 85% | 4 | 86.3% | 78.8 to 90.9 | 84.0 to 87.9 | 85.3% | 177 |
| 85% to under 95% | 8 | 80.9% | 75.8 to 85.0 | 76.2 to 83.9 | 79.7% | 597 |
| 95% and above (passed) | 46 | 85.0% | 83.1 to 87.1 | 81.5 to 89.1 | 83.4% | 2,368 |
Full methodology
Sources in detail. Housing Delivery Test: 2025 measurement (301 authorities with a numeric result). Planning decisions from the PS2 open data table in MHCLG's Live tables on planning application statistics (PS2 open data table), 1 April 2022 to 31 March 2025: the exact test window. Green Belt share of land area from Local authority Green Belt statistics for England: 2024 to 2025 (area at 31 December 2024); authorities absent from that table are treated as having no Green Belt. Authorities are joined on ONS code, not by name, with the two-code correction described in the data correction note below.
Cohort and outcome. "Major dwellings (all)": development of ten or more dwellings, or a site of half a hectare or more where the number is not known, assigned by principal use and including applications subject to performance agreements and extensions of time. Approval rate is granted divided by decisions over the twelve quarters. An authority is included with returns in at least ten of the twelve quarters (9 excluded, all reorganised: Allerdale, Carlisle, Copeland, Mendip, North Yorkshire, Sedgemoor, Somerset West and Taunton, South Somerset, Westmorland and Furness) and at least 20 major decisions (42 excluded, listed in the CSV). That leaves 250 authorities in England, 229 outside London.
Reserved matters and section 73. PS2 counts every decision on an application of the type, including approvals of reserved matters and section 73 variations, which are predominantly granted. The reported rate is therefore an upward-biased measure of the approval rate for brand-new schemes, and whether that bias varies between authorities cannot be established from PS2. Our pre-registration described the inflation as assumed uniform across authorities; subsequent review judged that assumption too strong, and no uniformity is claimed here. The one diagnostic available: across the 32 authorities where PlanningLens's own scheme-level measure (which excludes reserved matters and s73) covers at least 40% of PS2's decisions, the PS2 rate exceeds the PlanningLens rate by a median +2.5 points (interquartile range -1.0 to +8.3), with no obvious pattern against the test result (correlation -0.11) or Green Belt share (-0.12; median gap +3.2 points in Green Belt-heavy authorities, +1.8 elsewhere). Both measures are imperfect, so this is reassurance, not proof.
Data correction, 3 September 2026. MHCLG's Housing Delivery Test and PS2 files carry Sheffield as E08000039 and Barnsley as E08000038; MHCLG's Green Belt table carries the same two authorities as E08000019 and E08000016. In the analysis frozen on 2 September neither Green Belt row joined, so both councils were treated as having no Green Belt. The mismatch was found after those results had been read. Because it is an identifier error in the source files rather than an analytical choice, the two codes were mapped, the analysis was re-run unchanged in every other respect, and the results were re-frozen on 3 September; the correction is logged as amendment 4 of the pre-registration and both results files are published below. Sheffield (24.6% Green Belt) stays in the under-25% group; Barnsley (68%) moves to the 25%-or-more group, which becomes 85 councils against 144. Barnsley scored 75% on the test, so it is in neither the failing nor the passing band: the four headline medians and their sample sizes are unchanged. The two correlations moved from +0.45 to +0.44 and from +0.13 to +0.13, and the exploratory permutation p-value at the 20-decision floor from 0.011 to 0.016.
Decisions, not dwellings. PS2 counts decisions. Two councils with the same approval rate may have permitted very different numbers of homes. PlanningLens's scheme-level data, which can supply unit counts, is not used for any figure on this page.
Timing. Approvals and completions are measured over the same three years. Permissions granted in the window mostly complete after it, and homes completed in it were mostly permitted before it. The comparison describes whether the test's consequence tracks contemporaneous approval behaviour, which is what a decision-making sanction acts on.
Principal-use classification and London. Dense mixed-use schemes are filed under their principal commercial use, so "major dwellings" undercounts city-centre housing, most of all in London. London was analysed separately as the pre-registration required: 21 boroughs eligible, three in the passing band, correlation -0.30 (-0.72 to +0.21). It is reported in the results file and is not in the headline sample.
Statistics. Spearman rank correlation between test result and approval rate; 95% intervals by bootstrap over authorities (2,000 resamples, percentile method, seed 20260902). Medians per band with bootstrap intervals and interquartile ranges; the contrast between the failing and passing bands with its interval; decisions-weighted rates alongside medians. Interpretation rules fixed in advance: a correlation within 0.15 of zero whose interval lies within 0.30 of zero is "no meaningful relationship"; 0.15 to 0.30 is weak; 0.30 or more is moderate or stronger. No approval level is a pass-or-fail threshold. Every figure on this page, intervals included, is recomputed from the published CSV when the page is built and checked against the frozen results file.
Pre-registration. The question, sources, window, cohort, floors, bands, statistics, interpretation rules, cuts and anomaly rules were frozen at about 18:50 on 2 September 2026, before any PS2 decision value was read. The text at freeze has SHA-256 2ce6a5780b73f32f...c53f1608. Four amendments were logged afterwards in its section 12 (file encoding; the Green Belt source vintage; one extra reported cut; and, on 3 September, the Sheffield and Barnsley identifier correction described above); none altered a pre-registered cut, threshold or rule. The Green Belt split that forms the headline comes from a pre-registered sensitivity cut; the robustness checks on it were run afterwards and are labelled exploratory.